Career Data Charts
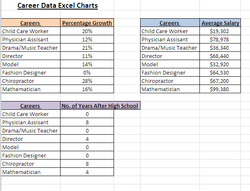
In this assignment, I had to create three charts on my career data. The charts were on the percentage growth of each of the eight jobs as well as the average salary and the number of years required after high school. This assignment did not have any new skills, just working on graphs and transferring information. If I could have done this over, I would have copied all of the jobs so I would not have to type them multiple times.
In this assignment I had to create a blog on Glogster.com. This blog was on my top career choice. I picked a Physician assistant. I had to include many different things into this blog. Including a description of the job, the average salary, education needed, technology skills, pictures, and a video. IN this project I had to learn to use many new skills. I had to learn how to use Glogster. The website itself was not challenging, but making my blog how I envisioned it was. I feel that I learned how to use Glogster well, but I could have worked harder and made the blog better and closer to how I saw it in my head.
Multimedia Reflection
When using a smartphone for video and Pixorial, I learned many different techniques like cropping and editing videos. I was also able to add songs before, during, and at the end of the video, as well as add credits and other words in the video. This could help me in the future if I ever need to make a video presentation, or if I want to make a video for my friends and family. I could also use this to make a picture video to remember any experiences and have them all on one video instead of multiple pictures.
